

.webp)
L'imagerie satellite relevait longtemps surtout des agences et des institutions publiques. Les archives d'observation de la Terre et les VLM permettent aujourd'hui d'exploiter des séries d'images pour suivre événements et changements de surface.
Le secteur s'appuie notamment sur des acteurs comme Liquid AI pour des modèles d'IA efficaces et déployables. Les enjeux environnementaux ou de risque se traduisent par ailleurs en tâches d'analyse d'image, avec des exigences de reproductibilité proches de l'industrie.
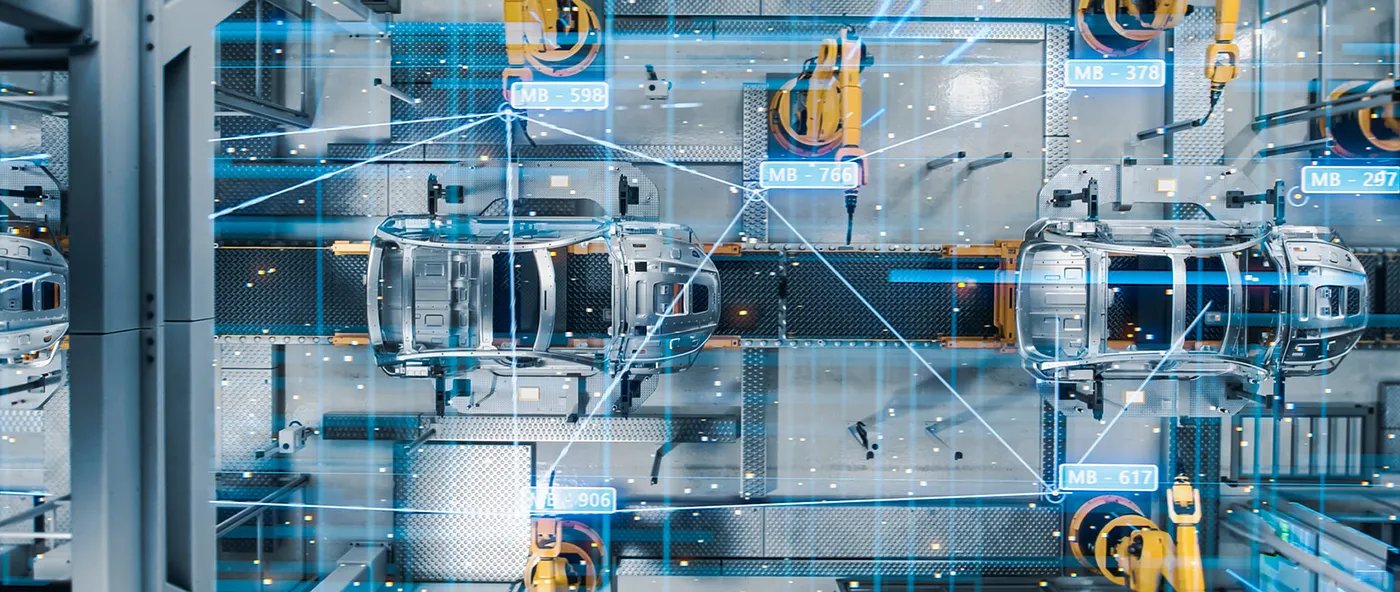
Computer Vision depuis l'espace : voir ce que l'humain ne peut pas
Les constellations produisent trop d'images pour une lecture humaine exhaustive. La vision par ordinateur segmente, détecte les changements et classe les scènes. Les VLM ajoutent une couche textuelle pour les workflows existants, sans remplacer les contrôles métier.
Le contexte : l'observation de la Terre à l'ère des VLM
L'accès aux données (Sentinel, Planet, Earth Engine, portails commerciaux ou institutionnels) est désormais courant. Le difficile est en aval : harmonisation, nuages, calibration et inférence sur longues séries. Les VLM rendent les sorties plus lisibles si l'on valide sur jeux de référence et si l'on documente les limites.
Les quatre cas ci-dessous illustrent des familles de méthodes récurrentes (changement, classification, segmentation, fusion) avec traçabilité et évaluation quantitative.
Parmi les acteurs qui poussent ce rapprochement, Liquid AI travaille sur des modèles d'IA efficaces adaptés au déploiement contraint, tandis que DPhi Space propose des serveurs et un hébergement logiciel en orbite pour exécuter des charges utiles directement dans l'espace.
1. Détection de déforestation illégale
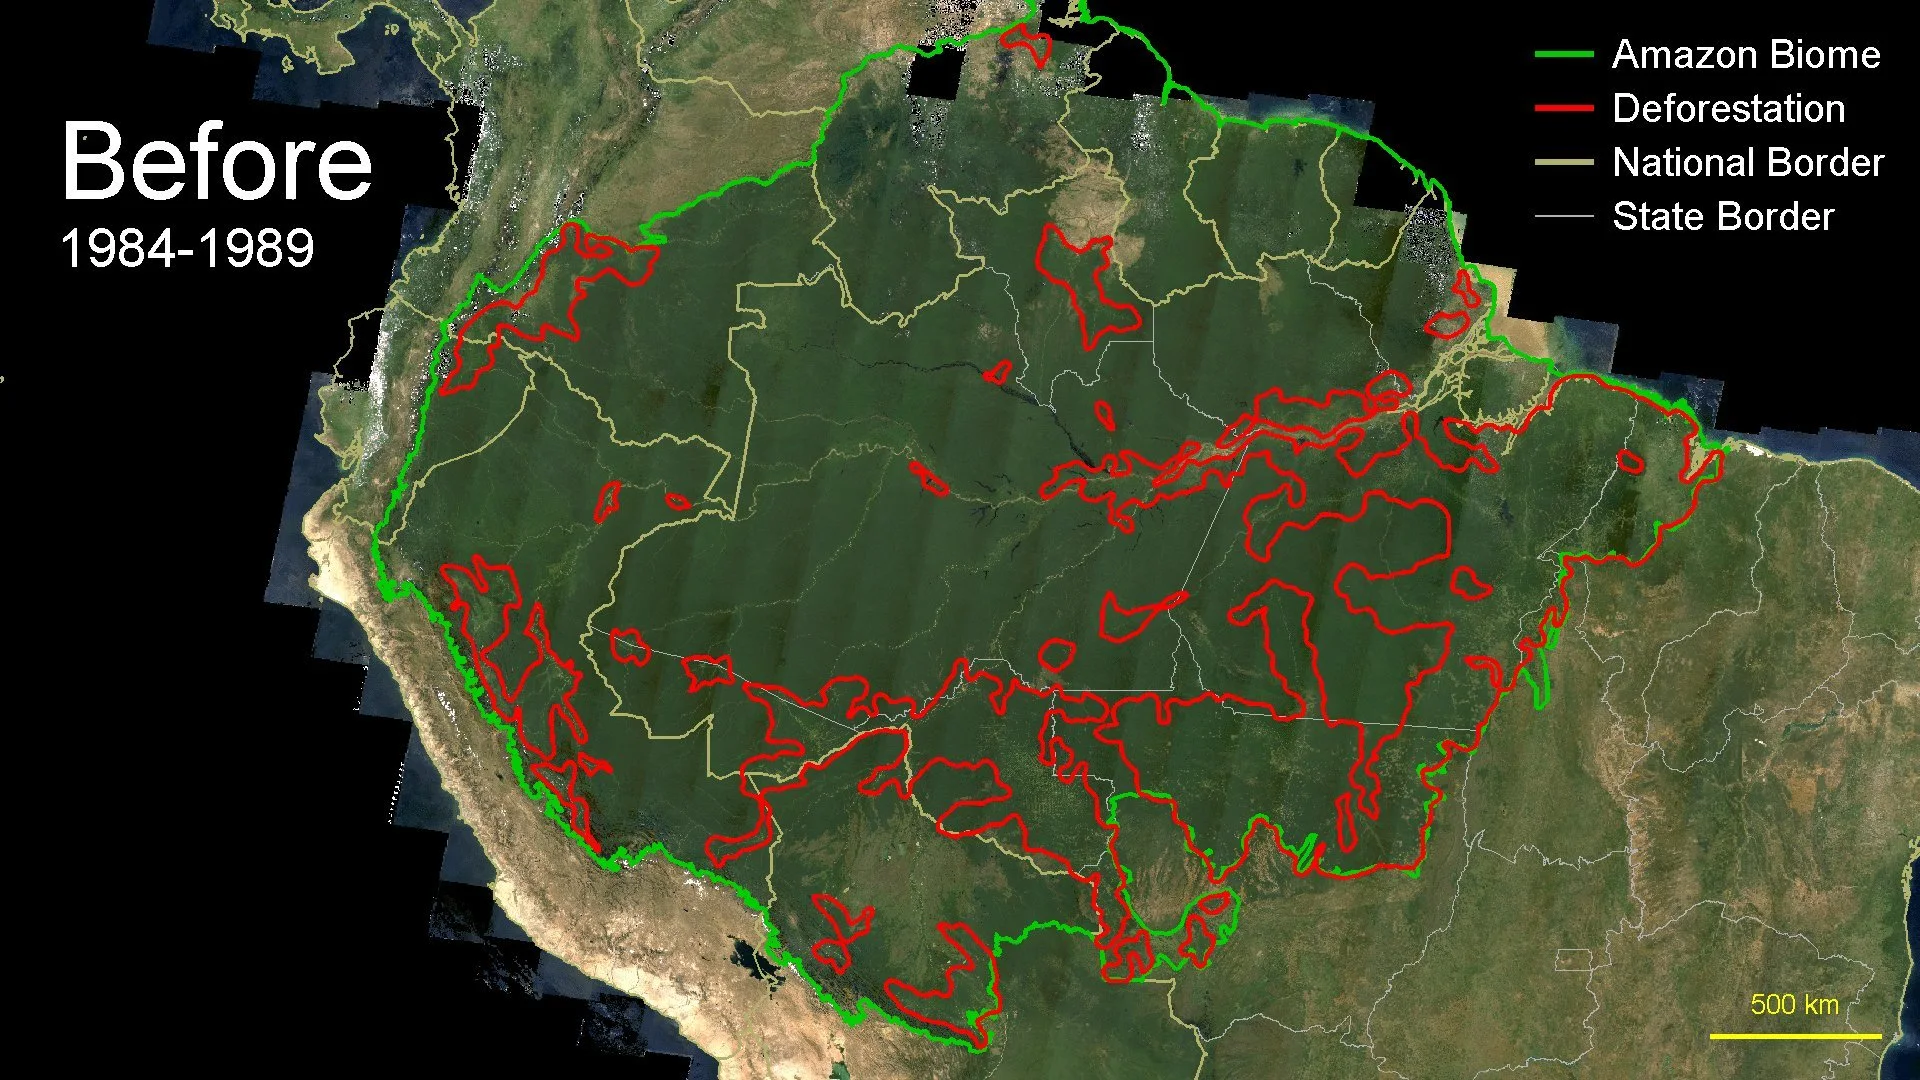
L'exploitation illégale laisse des traces visibles : routes, clairières, perte de couvert hors périodes autorisées. L'orbite permet une chronologie sur de larges zones, sans dépendre uniquement du terrain.
On aligne des paires ou séries d'images et on signale les écarts à la saisonnalité attendue. Les modèles multimodaux peuvent proposer des interprétations ; elles doivent être validées au sol ou sur annotations expertes.
Détection de changements et segmentation du couvert forment le socle habituel ; les VLM plutôt une synthèse textuelle qu'un substitut aux métriques. La même logique temporelle s'applique aux sites industriels ou chantiers.
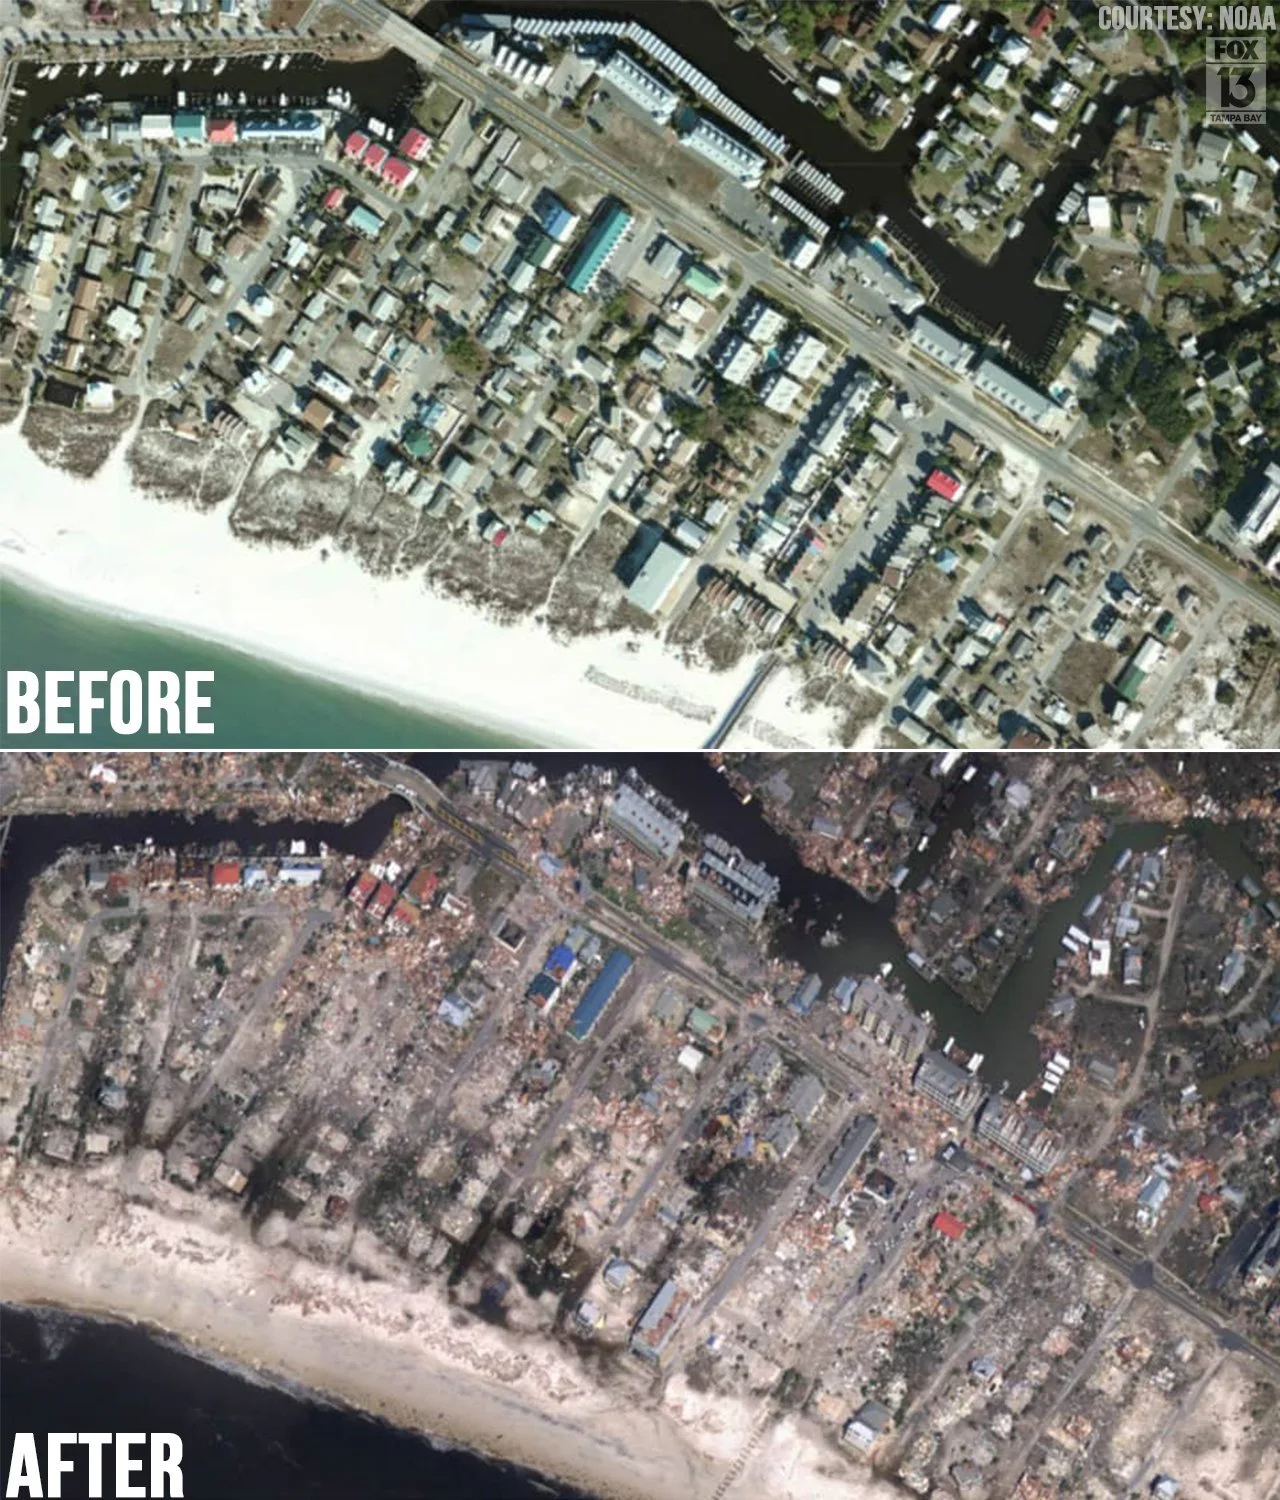
2. Évaluation automatisée des dommages pour l'assurance
Après un aléa majeur, prioriser et estimer à très grande échelle dépasse vite ce que permettent seules les expertises terrain, compte tenu du coût et des délais.
Des images avant et après l'événement donnent une vue d'ensemble. Des pipelines apparient les acquisitions, atténuent partiellement les nuages, puis assignent un état par unité spatiale (intact, dégradé, détruit, etc.).
On combine souvent classification multi-classes et différences entre dates ; la qualité dépend du jeu d'entraînement et du protocole de validation. Le même schéma (référence, écart, seuils) apparaît en contrôle qualité sur ligne.
3. Monitoring agricole par IA
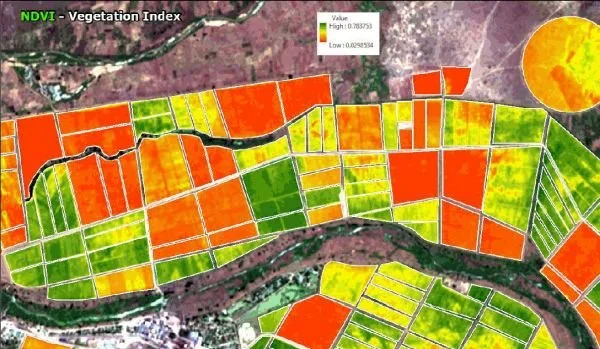
Le stress (eau, maladies, ravageurs) apparaît souvent dans le spectre avant d'être visible au pas sur la parcelle. Les séries à revisite élevée tracent des indices de végétation dans le temps.
Approche classique : segmentation par parcelle, correction atmosphérique si possible, suivi du NDVI ou de bandes proches. Les modèles multimodaux peuvent résumer en texte si les seuils d'alerte restent traçables.
C'est proche du suivi de processus industriel : dérive progressive, seuils, alertes calibrées sur l'historique, appliqué ici à des orbites plutôt qu'à des caméras fixes.
4. Surveillance des infrastructures critiques
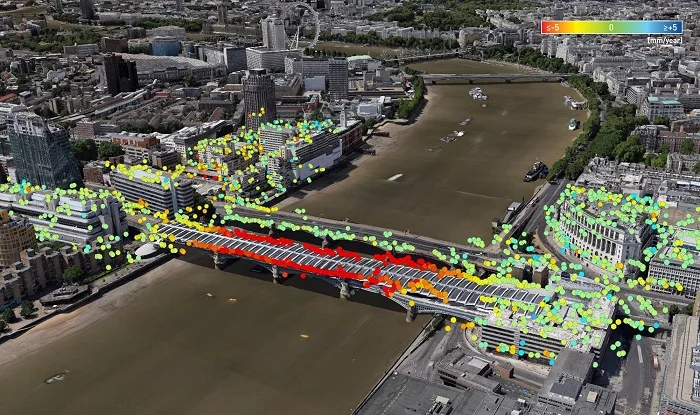
Les réseaux linéaires s'étendent sur des distances où une inspection homogène est irréaliste. Risques géomorphiques, occupation des sols et travaux non déclarés se repèrent souvent mieux par observation répétée.
On enchaîne souvent détection de structures, changements entre dates et segmentation autour des corridors. Plusieurs résolutions élargissent la couverture au prix d'une validation plus exigeante.
Même logique qu'avec des caméras sur site : suivre l'évolution des actifs, mesurer l'écart à une référence, n'alerter l'humain qu'au-delà d'un seuil validé.
Conclusion
Les exemples cités relèvent d'une dynamique ouverte. Des méthodes matures intégrées dans des pipelines traçables soutiennent des décisions à grande échelle.
Pour un besoin de computer vision spatial, industriel ou hybride, ARCY peut aider au cadrage, au prototype sur données réelles et au déploiement contrôlé.
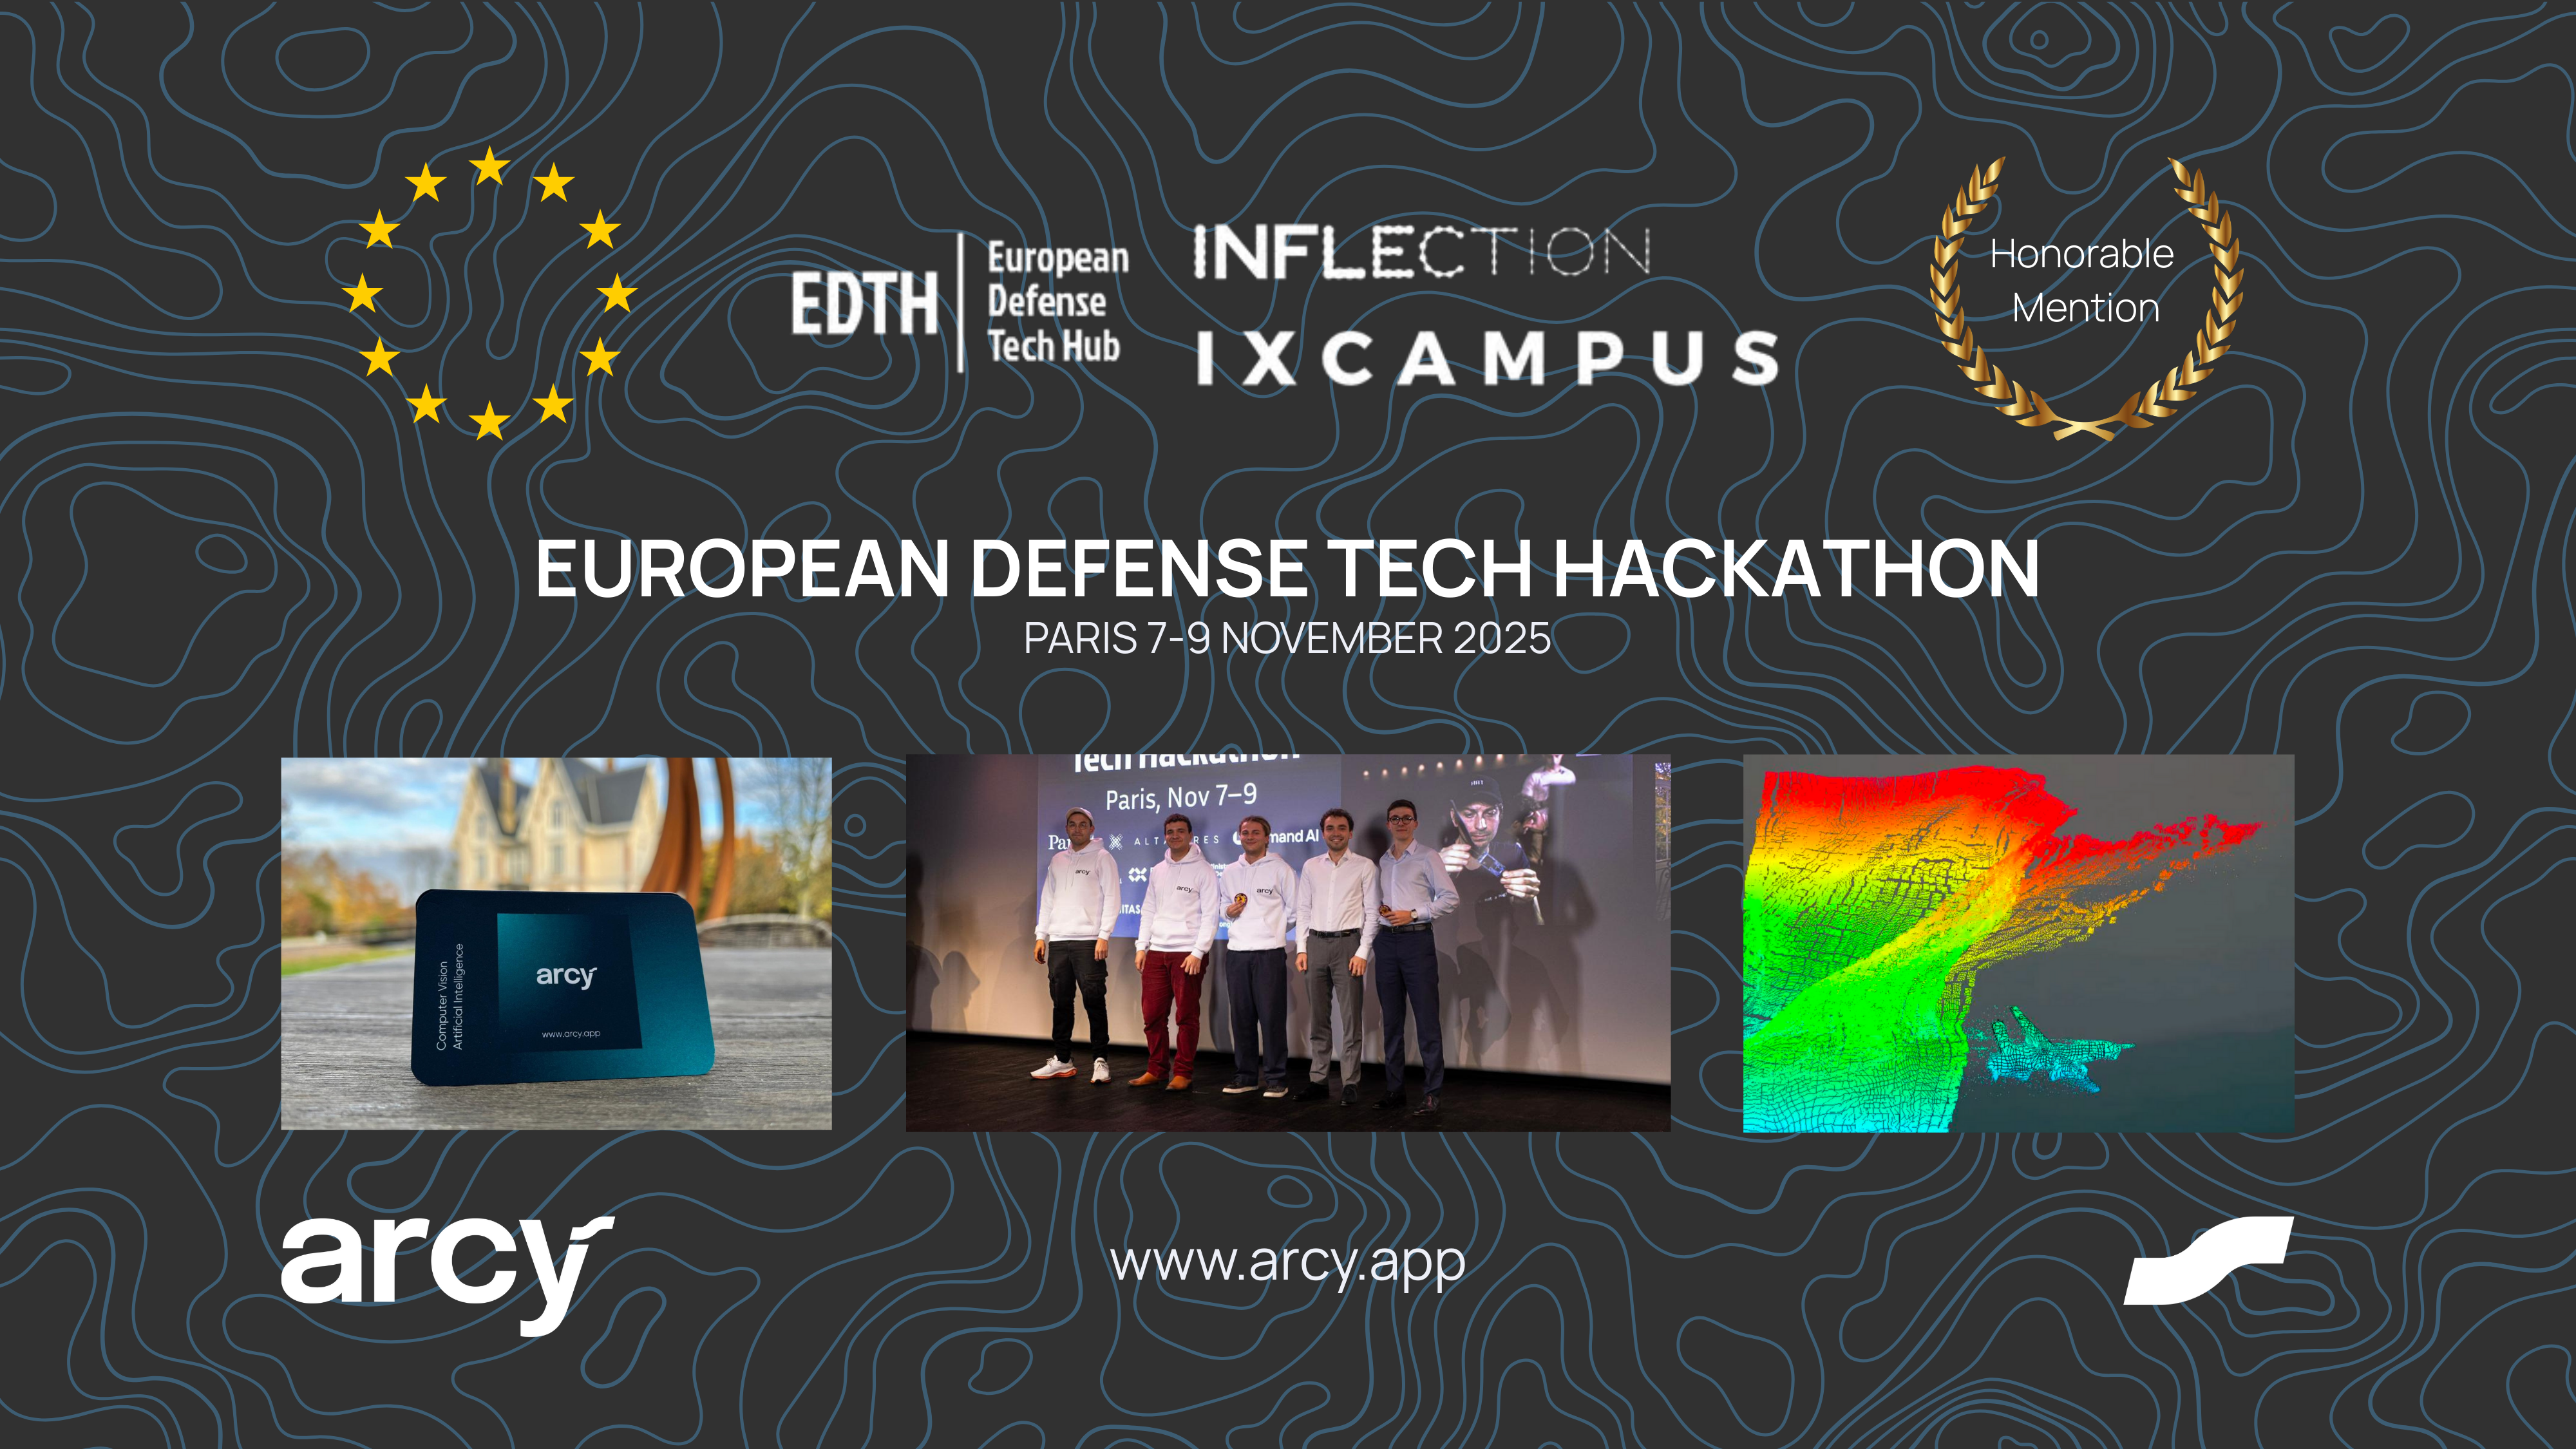
La même logique de détection de changements et de segmentation s'applique à l'inspection qualité industrielle. Côté prototypage rapide, notre retour du hackathon EDTH illustre comment ces pipelines se valident en conditions réelles.
Sources
Exemples visuels et fil d'inspiration : @paulabartabajo_ (X).